The Laboratoire de Cartographie, founded by Jacques Bertin in 1954, became known as the Laboratoire de Graphique in 1974 (it closed in 2000). It articulated the production of scientific images and the representation of data and research in the social sciences in a new way. The precursory character of the works of the Laboratory, made evident through the works of Bertin, was, from that point, internationally recognized. Bertin’s work on graphic semiology is a key source today, used not only by cartographers, but also specialists in the visual analysis of data and graphic design.
As of 1976, on a pedagogical level, research on the possible uses of graphics for teaching was conducted by Roberto Gimeno, then a colleague of Jacques Bertin’s at the Laboratoire de Graphique at the EHESS. These experiments were conducted at different grades in primary schools, and in secondary school classes. Children were asked to create matrices and maps in order to discover typologies, invent concepts and thus acquire new knowledge. Researcher Anne-Lyse Renon and graphic designer Stéphane Buellet met with Roberto Gimeno to measure, over three decades after the preceding article was published, the pedagogical legacy of the Laboratoire de Graphique.
cense:
Anne-Lyse Renon Roberto, you went to work with Jacques Bertin in the 1980s. How did this come about?
Roberto Gimeno I had been working as a teacher in Uruguay for over ten years. I had always been interested in images and I managed to acquire a position as a producer and director of educational television through a competition at the French Ministry of Education. Two years later, I received a grant from the French government to study audiovisual techniques and methods as part of the Institut National de la Recherche Pédagogique (INRP, the National Institute for Pedagogical Research) in Paris. It was there that I met the sociologist and linguist Louis Porcher who, in turn, introduced me to the work of Jacques Bertin. At the time, Bertin was directing the Laboratoire de Graphique at the EHESS, founded in 1954. Consequently, he accepted me as a student in 1974 and proposed that, as my thesis topic, I bring together my training as a teacher and as a graphic artist. It was thus that the research project on the use of graphics in education was born, and that I received access to schools in Neuilly, Levallois, Seine-Saint-Denis, etc. Over time, the network widened. I was invited to conduct workshops on the use of graphics in teaching, on dot-matrix processing and the representation of history, cartography, etc. A new generation of teachers became interested in the subject and the number of experiments increased.
When we began these projects, personal computers were not an affordable option. The question of computer graphics tools quickly came up as a means of replacing manual operations of cutting and pasting in order to create dot-matrix renderings directly on the screen, that is to say to display a two-way classification table which enabled the permutation of lines and columns in order to create rankings.
  The first computer was a Micral 80-22G (1978) made by the French company R2E, for whom Jean-Michel Fras and Pierre-Yves Vicens, of the École Normale de Livry-Gargan, created a first computer graphics tool for the classification of the lines and columns of a matrix and the creation of maps. This first tool was improved and redeveloped for Thomson’s TO7, TO7-70 and “nanoréseau,” which, from 1984–1985 on, was part of the Informatique pour Tous (IPT, “computing for everyone”) initiative. Unfortunately, Thomson’s choice of 8-bit graphics terminals was a catastrophe. It was intended to develop the French computer industry with the Minitel, but the light pen was not able to provide much resistance to the mouse of the Apple Macintosh (1984).
In this context, we responded to an invitation to tender of the Ministry of Education with two teachers from the École Normale d’Instituteurs at Antony, in the region of the Hauts-de-Seine. We presented a project for a vector processing and cartography software which subsequently gave birth to Cartax and Cartax PC, two software programs developed by Nathan Logiciels and purchased under license by the Ministry. These programs worked on MO5 machines with a 64 Kb RAM plug-in module. This is how the first computing tool dedicated to teaching was created, at the École Normale de Livry-Gargan in the early 1980s.
ALR Did cartography seem self-evident as a subject for study during your workshops, due to its presence in schools, or was its choice linked to the specific activities of the Laboratoire de Graphique?
RG Cartography has always been a part of scholastic programs, even though it is often limited to the copying of maps. Computing led to a new approach, enabling one to spatialize qualitative or quantitative data, produce comparable images and series of images that would place the student in a dynamic situation of reflection and research. This was the case in several areas: not only geography but also in history and social sciences in general. This pedagogical step was similar to that of the Laboratoire de Graphique directed by Bertin, whose aim was to create a graphics tool for research that would facilitate dot-matrix renderings. On the scholastic level, our work did not enable us to reach that goal, which is to say to pass automatically from a reorderable matrix to a geographic map. This research is still ongoing, notably with the software Khartis, developed by the cartography atelier at Sciences Po. This project is a direct legacy of the work Bertin did, but is unfortunately too complex to be used in elementary schools.
Stéphane Buellet Today there is still a gap between the virtually ubiquitous presence of technology in schools, and the difficulties encountered by the teaching staff in recognizing what a computer was, mastering its use and being aware of how to make use of it for teaching. I have the impression that this problem has remained the same over the last three decades.
RG The method Bertin proposed was of a scientific nature: one would ask questions, formulate hypotheses, outline an area of research and objects of study. We had at our disposal a visual and manual tool, the mutable matrix, that enabled us to perform a computation, discover object classes, obtain typologies and consequently be able to construct concepts. Also, the tool itself was an excellent medium with which to interpret the results and formulate a discourse or text. This learning of worked from first grade on and on all levels. In order to respond to your remark, with the help of researchers, teachers had no difficulties in learning the method. But, left to their own devices, problems appeared when it came to helping the children construct knowledge themselves.
SB Today, children are confronted very early on with a world of screens in which everything is flat and seems “immaterial.” In the work you do with little bits of paper, scissors, space and manipulation, isn’t there something to which one is currently returning? Revisiting materiality, especially for small children, as a departure point before proceeding towards abstraction… You developed this approach before the presence of computers in the classroom. Finally, we are returning to this: the questions you asked in your 1985 article on cartography and computing in teaching contain questions that are still being asked today.1010 “Cartographie et informatique dans l’enseignement,” op. cit.
RG Yes, we always begin with manual work. This enables us to pass without difficulty from the manipulation of matrices to the abstraction of the screen. These periods of oversight are curious, where later one rediscovers something that has already been developed as if it were new, ten or twenty years or even a century later, something that had seemed acquired.
SB In another 1985 article on the computer-assisted transmission of knowledge, you deal with the computer, the machine, as a sort of omnipotent “god” whose inner workings remain unknown.1111 Jean-Michel Fras, Roberto Gimeno, Pierre-Yves Vicens, “T.C.A.O. [Transmission des connaissances assistées par ordinateur] : Un plaidoyer pour une non utilisation à l’école élémentaire,” Elipse, C.D.D.P. 93, 1, February 1985, 3. Thus you say: “The myth of absolute knowledge being held by a machine again increases the possibility of transforming information technology into a “ghetto” accessible only to those “in the know,” and computers do the rest (is this the intent of computer scientists?). […] If we are not careful, the only referent children will have is the “big” computer (in the “theological” sense previously evoked, but debunked by Jacques Perret when he created the word “ordinateur” (French for ‘computer’) in 1955.) According to you, one must deconstruct this idea, notably by working “with” the machine. This enables children to understand that the computer performs tasks in a very powerful way, but also that they are capable of understanding its rules and that there is, subsequently, a limit to these protocols, limits in terms of what a computer can understand.
RG At the time I wrote the article you are citing, it was thought that a child should learn to program, then we became conscious that everyone could not become a computer scientist. On the other hand, we are all users. As a result, it is crucial to be conscious of what a computer is, how it works, what its limits are, and what it can do for us. I am not sure that it is currently what is being done in schools, even as students use computing terminals of all kinds every day. Already, at the time, I was surprised to observe children of a very young age for whom the computer was a common object, and easy to master, unlike adults.
SB These last years, “tactility,” the future of computing, closes the gap between children and computers to an even greater degree, notably through the use of tablets. One can see children of even two or three years of age using them with ease. The tactile rapport quickly becomes an attachment, even an addiction to the object.1414 “Pédiatres, psys ou enseignants, ils appellent à ’éloigner les tablettes des enfants’,” Le Monde (tribune), September 2015: http://b-o.fr/monde The classic input devices of keyboard/mouse seems to be virtually “erased,” and this has transformed the relationship that children had in the past with the computer as a object in an office into one where it is a source of excitement both captivating and indulgent.
RG Yes, while in the past, with the programming language LOGO, designed for children (1967), it was difficult to move around. You couldn’t do it directly on the screen, but only with the direction keys on the keyboard (up/down/left/right), which required a considerable effort of abstraction in order to transit from manual drawing to the creation of a map onscreen.1515 LOGO is an educational programming language developed at the end of the 1960s by Cynthia Solomon, Wally Feurzeig and Seymour Papert at the Computer Science and Artificial Intelligence Laboratory at MIT. Its syntactical rules are reduced to a bare minimum, and the vocabulary consists of words in everyday use. LOGO is derived from LISP, a family of programming languages created by John McCarthy at MIT in 1958. 
ALR Stéphane, upon reading Roberto Gimeno’s articles from the 1980s and 1990s, can you cite some examples of design projects that came about as a result of this research?
SB In order to remain within the realm of cartography, I think notably of Cameron Beccario’s Earth Wind Map project (2013) which enables one to visualize weather conditions around the world online.1616 http://b-o.fr/earth These maps are animated via data that is gathered every three hours: one can observe the wind and ocean currents, and can virtually “zoom into the map.” There are several projections and a wide variety of display parameters.
RG In my time, animation was still unknown, while it is highly present in the example you have cited. These dynamic transformations are very interesting but they don’t replace the possibilities of analysis of map series. The aims are different but the results are complementary. One must mention that, in elementary schools, we were working on the scale of the department, of France, and eventually, Europe. We rarely worked on a global scale.
SB Projections and orientations are often linked to visions and to political contexts which, for example, are more focused upon industrialized countries, such as the Mercator projection (1569). It is revelatory of the way in which we appropriate a territory or our knowledge of that territory. In this type of static image, there is a question of its composition and what one decides to show. On the other hand, in the new technical devices such as 360-degree cameras, or in the dynamic map background of the Earth Wind Map into which one can zoom, the question of a “choice of composition” disappears: the readers/viewers appear to be omniscient, and decide for themselves what they wish to see.
RG Absolutely, these political reflections were part of the courses in cartography. It was always a matter of ideological choices. In your example, one has the illusion of being able to freely navigate within a device, and yet it is still a matter of ideological choices, which are inevitable, even if they are unconsciously made.
ALR What is striking in this type of dynamic object, is the juxtaposition of maps that show, even if only because of the frame of the web browser, that the map always remains framed. A tool such as Google Earth (2001) provides the sensation of a three-dimensional realism, even as it remains a very elaborate simulation of reality. In fact, there are associated photographs that propose a particular sort of scripting that also provides an illusion of omnipotence.
SB Beyond this search for realism, these last few years there has been an explosion of what one refers to as “data visualization” in every form of media. The rediscovery of Bertin’s work via (among others) the retrospective that you organized, Anne-Lyse, at the EHESS, shows that many graphic designers use formal registries with historical origins of which they are unaware.1717 Design graphique et recherches en sciences sociales. Le Laboratoire de Graphique de Jacques Bertin, 1954-2000, retrospective exhibition at the EHESS (Paris) from November 14 to December 15, 2017, curated by Anne-Lyse Renon. http://b-o.fr/bertin As I read the 1985 article by Roberto Gimeno on cartography and computing in a pedagogical environment, there was something that really struck me. I discovered Bertin by chance for the first time in a thesis by Ben Fry, a student at MIT, and I said to myself, “Look at that, a Frenchman!”1818 Benjamin Jotham Fry, Computational information Design, thesis (BFA), John Maeda, advisor, MIT, Dept. of Architecture, Media Arts and Sciences, April 2004, 38 and 108: http://b-o.fr/fry3 I think that a great many of us graphic designers have rediscovered work done in France through an American point of view. This is a bit disconcerting, because it’s not directly a question of cartography, but of logical processes. In my projects, moreover, I often make use of the relationship between graphic design and programming, and try to play a bit with rules and strictures.
RG Bertin had been highly criticized when he affirmed that visual variables—which, according to him, translated “resemblance, order and proportionality, the three signifiers of graphic design”—were universal.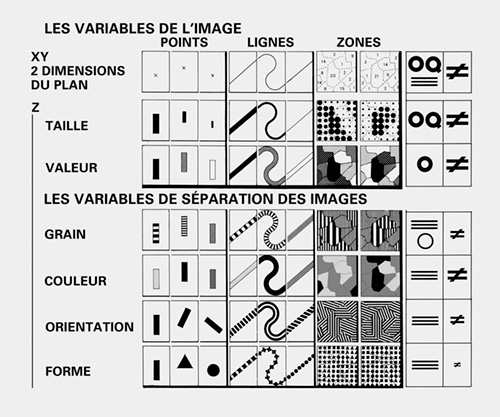 It would nevertheless seem that history and his legacy have proved him right. In order to express information in an efficient manner, one can only use certain signs and certain types of relationships that exist between these signs: these are visual variables and their properties. During the Bertin years, there was a tendency to “mathematize” the real in order to resolve questions of perception.
SB Bertin seemed to want to assign meaning to forms: this is the project of graphic semiology. Within this logic of systematization, even automation, I would like to have your opinion on the Datavizproject.com website which proposed a visual index, with an exhaustive ambition, of types of data (camembert, a cross-classification table, progress bar, etc.). One of the functionalities of this site enables one to associate the typologies of input, that is to say matrices, with types of visualizations (output) adapted to these data structures. In addition, in each case, there are concrete examples of use.
RG When I look at all these productions ;there are some really beautiful ones— I have a great deal of doubt about their capacities as precise representations of information. There is obviously the use of unadapted estheticized visual variables. Bertin considered that information should be perceived in one fell swoop. Otherwise the reader does not find himself before an image “to see,” but rather, an image “to read,”—most often it is an incomprehensible image. That is the risk when one makes form a priority. As Bertin would put it, one must make the choice between “seeing and reading.”1919 Jacques Bertin, “Voir ou lire,” Cartes et figures de la Terre, (Paris: Centre Georges Pompidou/Centre de création industrielle, 1980), 2-8.
Interview conducted at Tank (Paris), on November 23, 2017.